Climate Skepticism on Reddit
Introduction
In this project, we set out to explore climate skepticism as it manifests on Reddit. Our goals for this project are two-fold:
- Gain a deeper understanding of climate skepticism in a data-driven way
- Empower others to use Reddit data for research
We present a number of experiments which were carried out using the Pushshift Reddit API, provide a detailed walkthrough of the code so that others can recreate and extend our results, and endevour to visualize and analyze the data.
To our knowledge, this is the first data-driven analysis of climate skepticism on Reddit. All of the code for this project is available on GitHub.
Background
The role of humans in climate change was demonstrated over 100 years ago by Svante Arrhenius [ref], and since then a formidable body of scientific evidence has accumulated leading over 97% of scientists to conclude that human activity has a significant impact on the climate [ref]. An ever-improving collection of climate models even allow us to estimate the exact degree to which we will cause the planet to warm, and the details of how this will impact specific ecosystems and industries. Increasingly, these predictions are being validated by an increase in extreme weather events, collapsing ecosystems, and warming temperatures around the globe.
Despite the overwhelming evidence of anthropogenic global warming (AGW), in general we have been incredibly slow to take significant action to mitigate our impact on the climate. There are many factors contributing to this hesitation — one of which is widespread skepticism or denial of the reality of AGW. For certain individuals and companies (most notably fossil-fuel industries), avoiding climate action is a profitable strategy in the short term. As a result, they have mounted numerous campains to spread misinformation and discredit climate science [ref].
Moving the needle on climate action will likely require us to convince climate skeptics of the reality and severity of this issue. Before we can do so effectively it is critical to understand why and how people deny AGW, and so we turn to the treasure trove of content generated by climate skeptics on the internet.
We considered doing an anlysis of Twitter or Facebook, as we believe those platforms to be largely representative of the general population. However, significant research has been done on those platforms in the past (discussed in the Related Work section). In the interest of making a novel contribution, we decided to study climate skepticism on Reddit.
Sample Bias
A taste of Reddit demographics [ref]:
- 67-69% male
- 54% US-based users
- Similar racial distribution to US pop.
- 58% age 18-29, 33% age 30-49
So Reddit appears to be skewed towards males and a younger demographic. We also found from various sources on Reddit, in the news, and in our data, that Reddit is skewed liberal. This selection bias is worth keeping in mind throughout the analysis.
Pushshift API
Reddit is special among the large social-media platforms in that it provides a free, extensive API for interacting with content on the platform. The API exposes nearly all the functionality that a regular user would have when browsing reddit.
The pushshift API has two active endpoints, which can be found at:
- Comment Endpoint: https://api.pushshift.io/reddit/search/comment
- Submission Endpoint: https://api.pushshift.io/reddit/search/submission
Try following these links and inspect the results in your browser. For the comments endpoint, you should see something like this:
{
    "data": [
        {
            "all_awardings": [],
            "approved_at_utc": null,
            "associated_award": null,
            "author": "12UglyTacos",
            "author_flair_background_color": null,
            "author_flair_css_class": null,
            "author_flair_richtext": [],
            "author_flair_template_id": null,
            "author_flair_text": null,
            "author_flair_text_color": null,
            "author_flair_type": "text",
            "author_fullname": "t2_g0vwsy8",
            "author_patreon_flair": false,
            "author_premium": false,
            "awarders": [],
            "banned_at_utc": null,
            "body": "Good luck girl! Let us know how you do! \n\n<3",
            "can_mod_post": false,
            "collapsed": false,
            "collapsed_because_crowd_control": null,
            "collapsed_reason": null,
            "created_utc": 1575947859,
            "distinguished": null,
            "edited": false,
            "gildings": {},
            "id": "facv822",
            "is_submitter": true,
            "link_id": "t3_e72kna",
            "locked": false,
            "no_follow": true,
            "parent_id": "t1_f9xve3h",
            "permalink": "/r/entwives/comments/e72kna/decided_my_2020_resolution_was_to_learn_to_french/facv822/",
            "retrieved_on": 1575947860,
            "score": 1,
            "send_replies": true,
            "steward_reports": [],
            "stickied": false,
            "subreddit": "entwives",
            "subreddit_id": "t5_2s7a6",
            "total_awards_received": 0
        },
        ...
As we can see from the JSON result, each comment has a lot of associated information that might be useful to us. Here are some of the fields that stand out as particularly useful:
"body": the actual text of the comment"author": the username of the user who submitted the comment"subreddit": the subreddit that the comment is in"created_utc": a unix timestamp indicating when the comment was created
The result returned by the submission endpoint has a similar structure, but with different fields for each submission. Here’s a descripton of some of the relevant fields for each submission:
"title": the title of the submission"selftext": the body of text inside the submission (optional: not all submissions have selftext)"domain": the domain of a website that the submission links to (optional: not all submissions have domains)- “
subreddit_subscribers”: the number of members in the subreddit of this submission "author": the username of the user who submitted the submission"subreddit": the subreddit that the comment is in"created_utc": a unix timestamp indicating when the submission was created
We can farther filter the results from each endpoint using API parameters. The full list of parameters can be found here. Suppose we want to look at the titles and authors of posts in r/conservative which mention “climate change.” Our parameters would be
filter=author,titleto return only the authors and titlesq=climage%20changeto query for content containing the phrase “climate change” (%20is ASCII for a space)subreddit=conservativeto search within the r/conservative subreddit
We compose all of these parameters by
api url + ? + param1 + & + param2 + & + param3 ...
So our finished URL would look like:
And if we visit that URL in browser we get
{
    "data": [
        {
            "author": "OneBernie2020Please",
            "title": "Nuclear power key to solving climate change"
        },
        {
            "author": "optionhome",
            "title": "Teenage climate activist Greta Thunberg is a stunning inspiration to us all. She is in her 18th month on strike from school. \u201cYeah, uh, climate change or whatever it\u2019s called is super important to me,\u201d says James Davidson, 17, \u201cso that\u2019s definitely why I stopped going to school two years ago."
        },
        {
            "author": "Foubar",
            "title": "Elizabeth Warren Unveils Plan To End Climate Change By Performing Authentic Rain Dance"
        },
        {
            "author": "YanksSensBills",
            "title": "What do you think the GOP can do to address climate change?"
        },
        {
            "author": "Foubar",
            "title": "Climate Alarmists Want to Rebrand \"Climate Change\" to Something More Panic Inducing"
        },
        ...
If we go to https://api.pushshift.io/meta, we’ll see that the Pushshift API has a rate limit of 120 requests per minute - that’s one every 0.5 seconds. Therefore, we will want to slow our requests down by waiting 0.5 seconds between requests.
The pushshift API caps the number of results returned for a single request to 1000. Each result contains data about either a comment or a submission depending on the endpoint queried.
Experiments
Making Simple Queries
Let’s start by using python to programatically make a request.
First, we’ll want to import python’s requests library for making API requests, as well as the time library so that we can make sure not to exceed the Pushshift API’s rate limit.
import requests
import time
Now, let’s write a function called query which takes in as input the name of the endpoint, which should be "comment or "submission", as well as a dictionary of query parameters. The function should query the endpoint with the given parameters and return the result as a list of dictionaries.
def query(endpoint, params):

    params_string =\
        "&".join(f"{param}={val}" for param,val in params.items())
    url = f"https://api.pushshift.io/reddit/search/{endpoint}/?{params_string}"

    r = requests.get(url = url)
    data = r.json()
    return data["data"]
This works great if we want up to 1000 results, but if we try to ask for more than 1000 results, this will not work because of pushshift’s size limit. This means that we’ll have to make multiple requests until we have the desired number of results. For example, if we want to get 2500 results, then we can make 3 API calls, querying for 1000 results in the first 2, and 500 results in the third.
We’ll also want to call time.sleep with an argument of 0.5 to tell python to wait 0.5 seconds after each request.
def query_n(endpoint, params, n = 1000):
params.update({"sort_type": "created_utc", "sort":"desc", "size":n})
results = []
while len(results) < n:
query_res = query(endpoint, {**params, "before": results[-1]["created_utc"] if results else int(time.time()) })
if not query_res:
return results)
results.extend(query_res)
time.sleep(0.5)
return results
Great! Now that we know how to make requests, let’s dive into the data.
Topic Modelling
In natural language processing, topic modeling is the task of identifying topics within a collection of documents. Here, we use the word document to refer to any chunk of text which could be made up of arbitrarily many sentences. Given a collection of documents and a desired number of topics num_topics, a topic modeling algorithm can produce num_topics topics, each of which is characterized by a distribution over the vocabulary of words. For example, a topic could be characterized by the following distribution of words: 50% "composting", 40% "sustainability", 10% "recycling"”. These words and their respective weightings indicate that one of the topics discussed by a significant proportion of documents involves composting and sustainability, with some mentions of recycling.
We’ll be using Latent Dirichlet Allocation (LDA), which is one of these topic modelling algorithms.
In order to perform topic modeling, we’ll need a few python libraries:
# For Preprocessing
from nltk.tokenize import RegexpTokenizer
from nltk.corpus import stopwords
from nltk.stem.porter import PorterStemmer
# For Latent Dirichlet Allocation
import gensim
Next, let’s define a function that will preprocess the documents and perform topic modelling:
def lda(docs, num_topics = 2, num_words = 4, num_passes=20):
	# Setup
	stop_words = set(stopwords.words('english'))
	tokenizer = RegexpTokenizer(r'\w+')
	porter_stemmer = PorterStemmer()

	for i, doc in enumerate(docs):
		# 1. Lowercase and tokenize each document
		tokens = tokenizer.tokenize(doc.lower())
		# 2. Remove any stop words
		stopped_tokens = [tok for tok in tokens if tok not in stop_words]
		# 3. Apply porter stemming
		docs[i] = [porter_stemmer.stem(stopped_tok) for stopped_tok in stopped_tokens]

	# Create a dictionary and a corpus for LDA
	dictionary = gensim.corpora.Dictionary(docs)
	corpus = list(map(dictionary.doc2bow, docs))
	# Train the LDA model
	lda_model = gensim.models.ldamodel.LdaModel(
					corpus,
					num_topics = num_topics,
					id2word = dictionary,
					passes = num_passes)
	# Return the generated topics
	return lda_model.print_topics(num_topics=num_topics, num_words = num_words)
At this point, we’re ready to apply LDA to a subreddit. In the case of reddit, we want to know what different submissions and comments are discussing, so each document for LDA can be submission or a comment from the subreddit we are investigating.
def topic_modeling_within_subreddit(subreddit, num_topics = 10):
    print(f"Creating docs for subreddit: {subreddit}" )
    results = query_n("submission", {"subreddit": subreddit},  n = 25000)
    results.extend(query_n("comment", {"subreddit": subreddit},  n = 25000))
    text_fields = ["title", "selftext", "body"]
    docs = ["\n".join([result.get(field, "") for field in text_fields]) for result in results]
    return lda(docs, num_topics = num_topics)
Let’s try it out! We can start by asking for the 10 topics that best characterize r/climateskeptics, and compare it with the 10 topics that best characterize r/sustainability.
for subreddit in ("climateskeptics", "sustainability"):
	print(f"Topics for subreddit: {subreddit}")
	print(topic_modeling_within_subreddit(subreddit))
Subreddit Similarity
Each subreddit represents a community, so a natural line of inquiry is to examine how various subreddits relate to eachother. Perhaps the simplest approach to this task is to examine the overlap in members between two subreddits. On Reddit, an invididual’s subscriptions to various subreddits are kept anonmymous. We were able to find third party tools which can scrape subscription information for individual users, but each query takes on the order of minutes. A much quicker approach to proxy subscription information is to see which users have made submissions or comments in a subreddit.
For each subreddit that we would like to investigate we
- pull the n most recent posts (submissions or comments)
- Find the unique authors which created those posts (using a python
set)
We now have a set of of contributors for each subreddit. We can now consider simple set-comparison metrics, like the Jaccard Index (aka Intersection over Union)

which is a measure of similarity between sets A and B. We define the Jaccard index in clustering_subreddits.py
def intersection_over_union(a, b):
    return len(a & b) / len(a | b)
The function get_authors(subreddit) defined in scrape_members.py pulls a unique list of authors for the specified subreddit by scraping the history of content for that subreddit. So let’s test out our subreddit similarity metric!
a = set(get_authors('climateskeptics'))
b = set(get_authors('environmental_science'))
c = set(get_authors('conservative'))

print('r/climateskeptics with r/environmental_science',\
	intersection_over_union(a, b))
print('r/climateskeptics with r/conservative',\
	intersection_over_union(a, c))
This prints
r/climateskeptics with r/environmental_science 0.006036217303822937
r/climateskeptics with r/conservative 0.015847216578626575
Indicating that the r/climateskeptics community has more in common with r/conservative than it does with r/environmental_science.
Clustering Subreddits
Ideally we wouldn’t have to hand-pick pairs of subreddits to compare, because in doing so we are potentially restricting ourselves to only find trends which we already believe to be present in the data. In order to cast a wider net, we’d like to pursue an analysis which compares many subreddits at once, and discovers trends on its own. In this experiment we consider clustering subreddits based on their membership sets (from the previous section) and visualizing those clusters with dimensionality reduction.
In particular, we will use sklearn’s implementation of PCA for dimensionality reduction and KMeans for clustering, though any number of alternative methods may apply here.
Both of these methods expect data points with vector-representations, but we currently have sets of members for each subreddit. In order to create a vector for each subreddit, we first create a set consisting of all the members which have posted across all the subreddits. Let’s say this set is size, N. Then, for each subreddit, we create a vector of length N, where the ith element in the vector is a 1 if the ith member is in that subreddit, and a 0 otherwise.
For example, if users alice and candice have posted in r/climateskeptics but bob, and david have not, the vector for the r/climateskeptics subreddit would look like the first row of this table.
| alice | bob | candice | david | |
|---|---|---|---|---|
| r/climateskeptics | 1 | 0 | 1 | 0 |
| r/conservative | 1 | 0 | 0 | 1 |
| r/environmental_science | 0 | 1 | 1 | 1 |
If we have vectors for multiple subreddits, we end up building a matrix, where each row is a vector for a subreddit, and each column is a vector indicating where each user has been active. The code to generate this matrix lives in clustering_subreddits.py
def generate_matrix(subreddits):
    membership_list = {} # dict from subreddit -> membership set
    authors = set() #      set containing all the authors accross subreddits

    # for each subreddit, get the membership set
    for s in subreddits:
        print('Pulling authors for {}'.format(s))
        a = get_authors(s, endpoint='submission', max_num_authors=2000)
        authors.update(a)
        membership_list[s] = a

    authors = sorted(authors)
    n_subreddits = len(subreddits)
    n_authors = len(authors)

    # instantiate the matrix of zeros, and mark 1s as needed
    M = np.zeros([n_subreddits, n_authors], dtype=int)
    for i, s in enumerate(subreddits):
        for j, a in enumerate(authors):
            M[i,j] = a in membership_list[s]

    data = (subreddits, authors, M)
    return data
This function takes a while to run, depending on how many authors we request from get_authors (defined in scrape_members.py), and how many subreddits we pass in the argument list. Once we’ve built the matrix, we can use unsupervised learning to cluster subreddits based on their similarity. In this case, we’ll explore sklearn’s KMeans. It’s worth noting that KMeans exhibits the implicit prior that each of our clusters should be roughly the same size, which may or may not be a valid assumption depending on the data…
def cluster_matrix(data, n=2):
    subreddits, authors, M = data
    return KMeans(n_clusters=n).fit_predict(M)
This function will return a vector of labels, one for each subreddit. Each label will be an integer specifying which cluster the subreddit has been assigned to, where the argument n specifies the number of clusters to build. We could print out and read these clusters of subreddits, but let’s take things a step farther and try to visualize our data. Unfortunately, we can’t directly plot high-dimensional data (the dimensionality of our data is the number of unique users). Instead, we’ll use PCA to project our data into a lower dimension. We’re using matplotlib to scatterplot the results, and we color each point according to the labels obtained with KMeans.
def pca_matrix(data, labels=None):
    subreddits, authors, M = data

    # project the matrix into two dimensions
    pca = KernelPCA(n_components=2)
    pca.fit(M)
    projected = pca.transform(M)

    # and plot the results!
    fig, ax = plt.subplots()
    ax.scatter(*projected.T, c=labels)
    for i, s in enumerate(subreddits):
        ax.annotate(s, projected[i])

    plt.show()
Putting it all together
data = generate_matrix(subreddits)
data = remove_too_small(data, 900) # some subreddits don't have enough members
y = cluster_matrix(data, 4) # cluster with 4 clusters
pca_matrix(data, y)
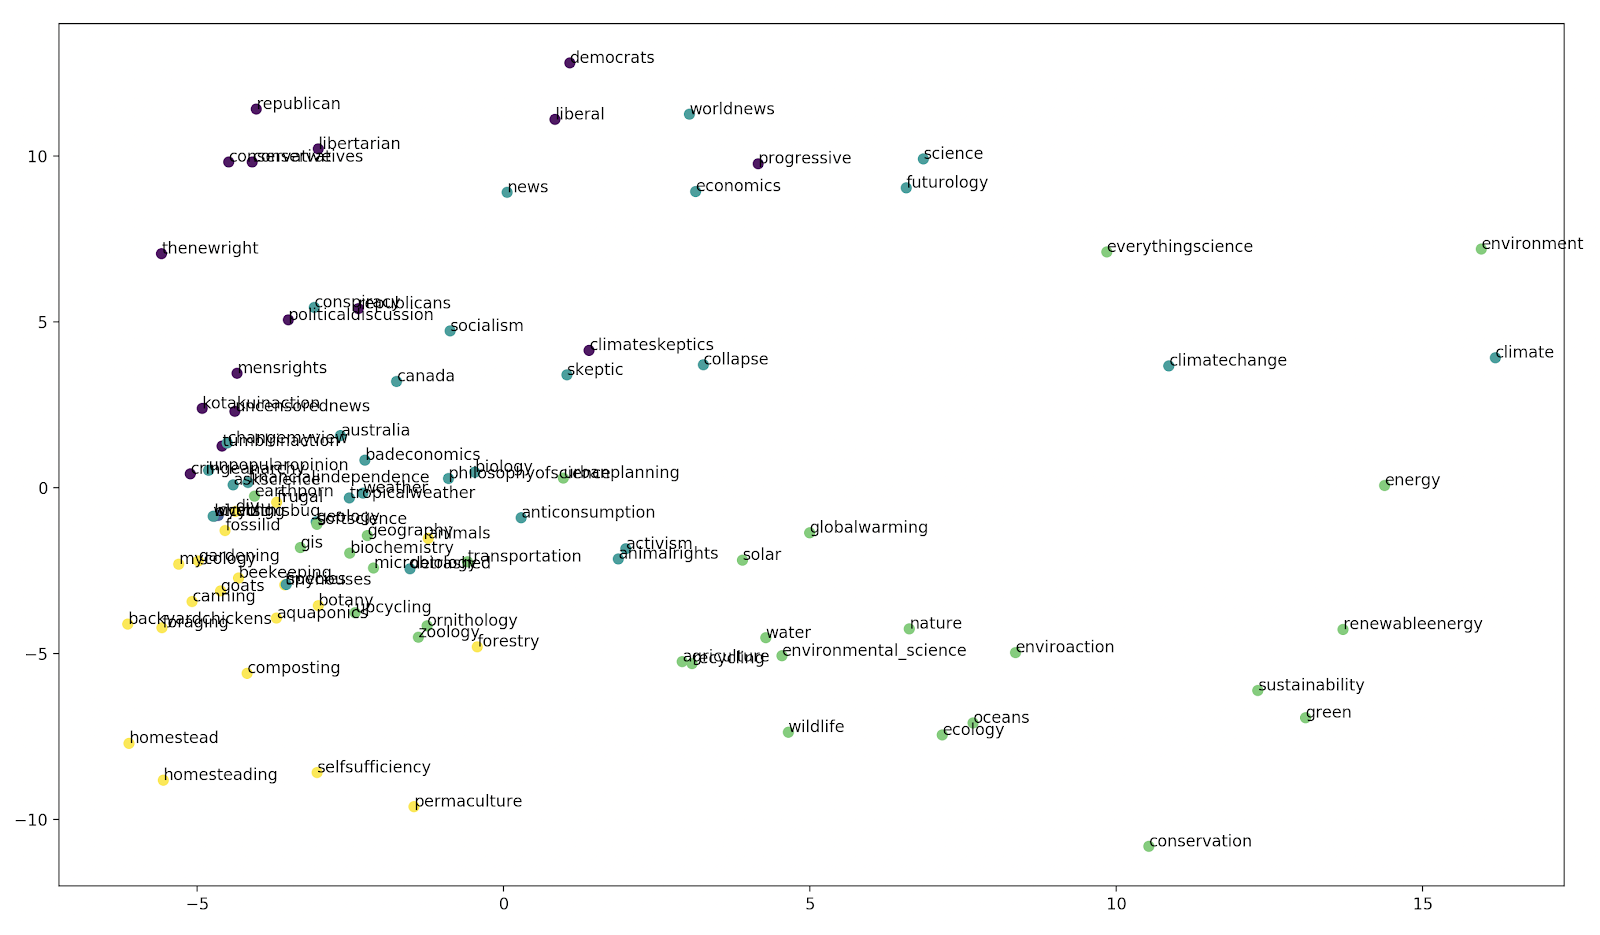
where subreddits is a list of subreddits and remove_too_small removes subreddit vectors with fewer than a certain number of members. This generates the plot:
 </img>
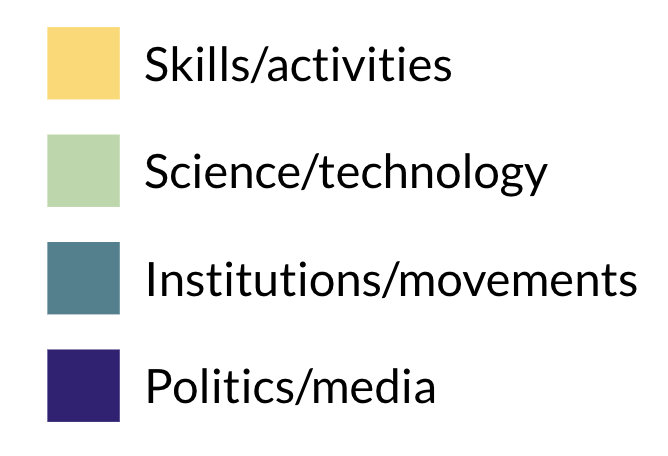
What does this mean? The 4 clusters don’t have a set meaning, as they were discovered in an unsupervised manner by KMeans, but we can attempt to interpret them by looking at the labeled subreddits
 </img>
From this we can make a significant observation: that the r/climateskeptics fits into the political cluster more than into any of the more scientific or activist clusters.
Word usage trends
So far, our analysis of Reddit data has been static in time; we’ve been agregating data across time, but it’s also worth investigating how various metrics have changed over time. We chose to track word usage as measured by the frequency of posts containing that word.
For the subreddit of interest, we pull all the content using pushshift_get from util.py. This is then passed to a function that iterates through each post and checks if the post contains one of our words of interest:
def build_timeseries(content):
    # content is a list of submissions or comments
    for c in content:
        for w in words:
            # check if the word is in the title, body or selftext
            if ('title' in c and w in c['title'].lower())\
            or ('selftext' in c and w in c['selftext'].lower())\
            or ('body' in c and w in c['body'].lower()):
                # if so, add the created_utc field to the list
                time_series[w].append(c['created_utc'])

        # also maintain a reference of all content timestamps so that
        # we can compare the word frequency
        reference_time_series.append(c['created_utc'])
This function populates timeseries which is a dict mapping each word to a list of UTC timestamps for the posts in that subreddit containing that word. We also populate reference_time_series which is a list of the timestamps of all posts.
If we wanted to calculate the fraction of posts which contain a certain word, say “apple”, we’d simply sum up the number of timestamps for that word and divide it by the number of reference timestamps.
apple_fraction = len(timeseries["apple"]) / len(reference_time_series)
However, since we’re interested in observing how this fraction may have changed over time, we need to sum up the timestamps within temporal bins. We can use np.histogram to count the number of timestamps within each bin and then normalize (divide each bin of the histogram by the reference bin) to find the fraction
def plot_histograms(num_bins):
    start_time = min(reference_time_series)
    end_time = max(reference_time_series)
    bins = np.linspace(start_time, end_time, num_bins)

    ref = np.histogram(reference_time_series, bins)[0]
    for w in words:
        hist = np.histogram(time_series[w], bins)[0]
        plt.plot(utc_to_year(bins[:-1]), hist.astype(float)/ref*100, label=w)

    plt.xlabel('Post Date (yr)')
    plt.ylabel('Percentage of posts containing word')
    plt.title('Word usage over time for r/{} {}s'.format(subreddit, endpoint))
    plt.legend()
    plt.plot()
    plt.show()
This function creates a normalized histogram for each word and plots the results, which are shown below for the comment and submission endpoints and two different subreddits
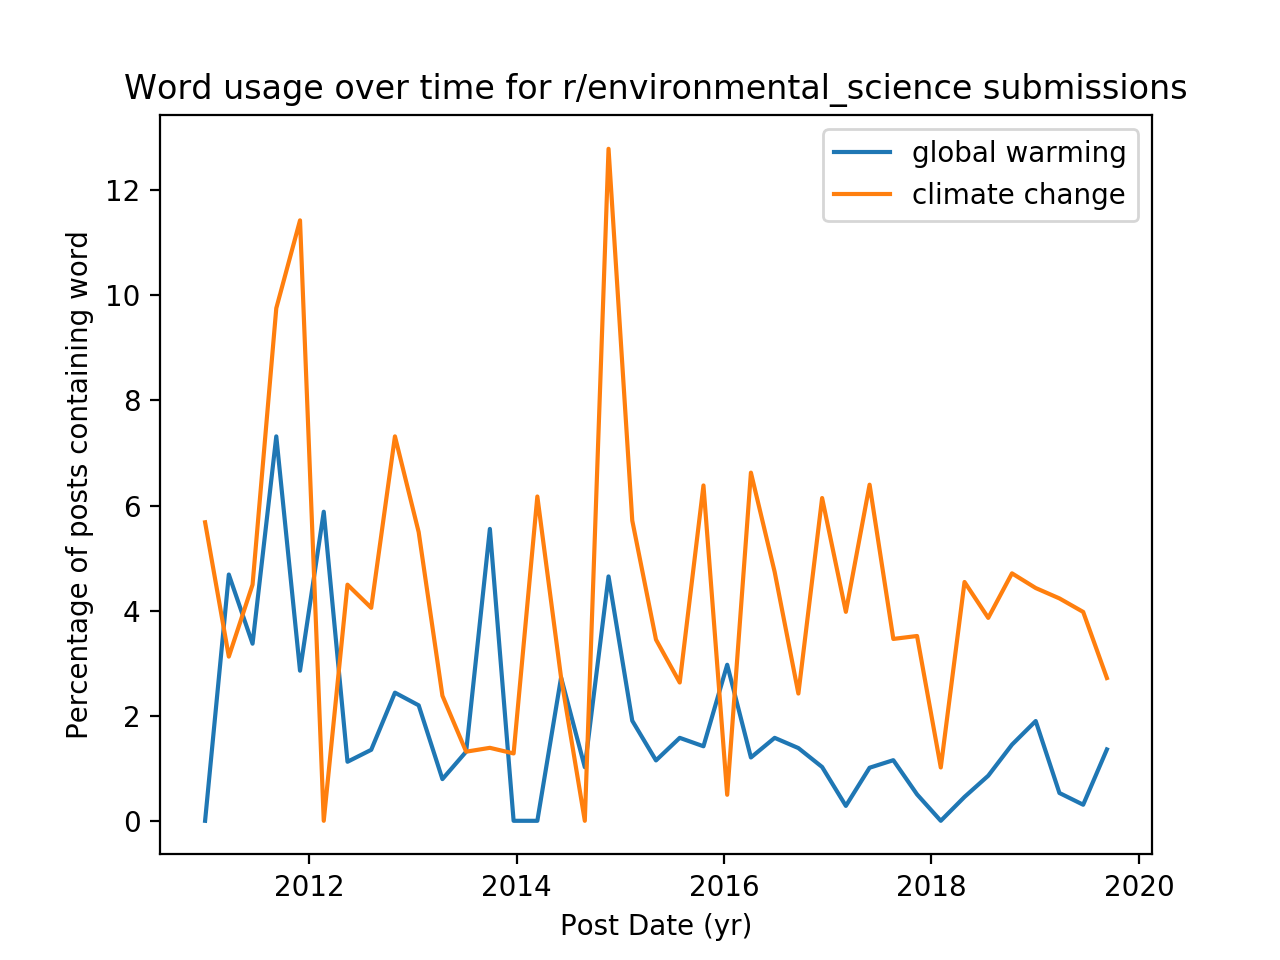
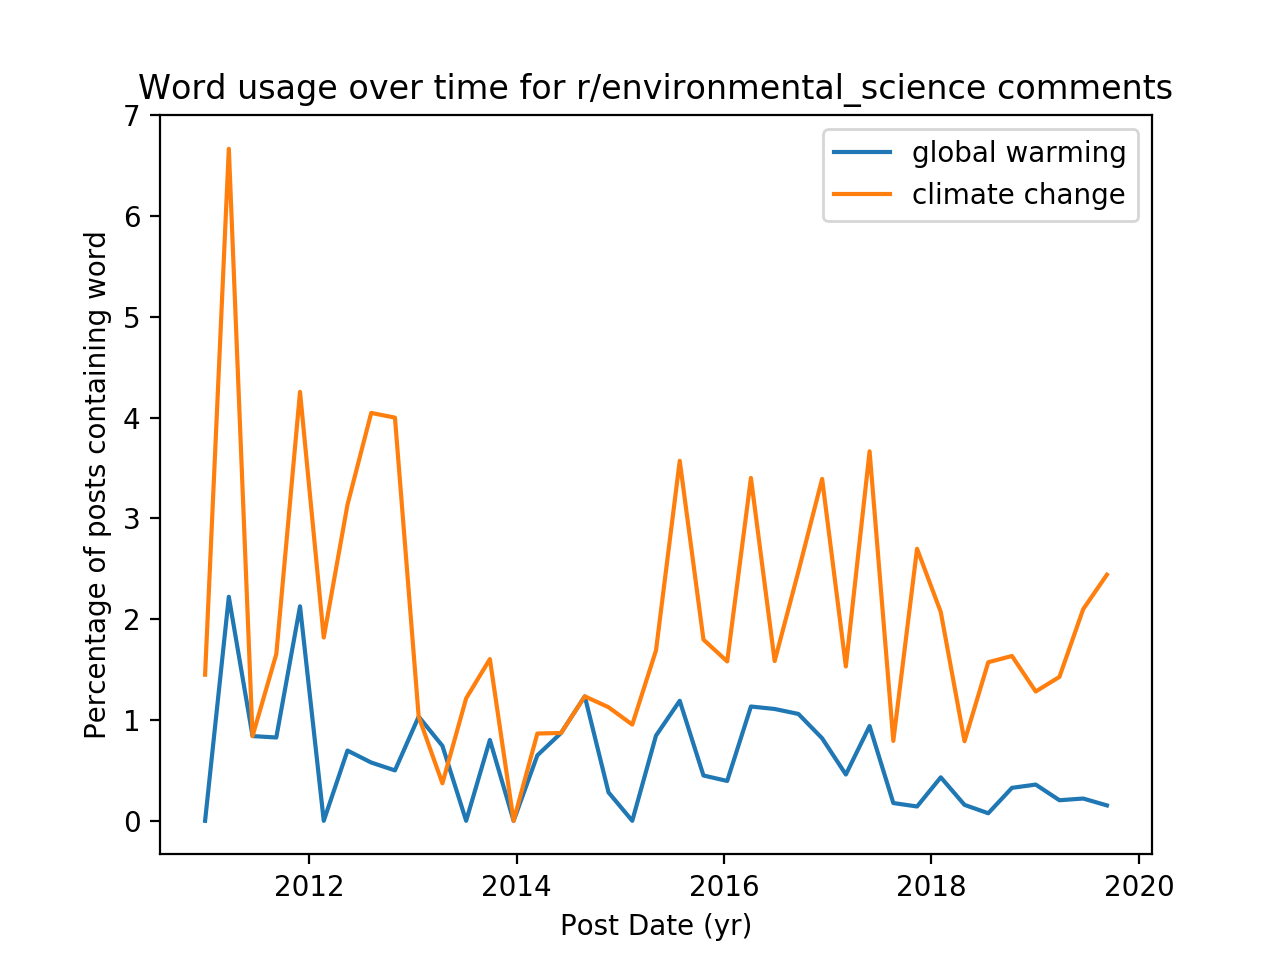
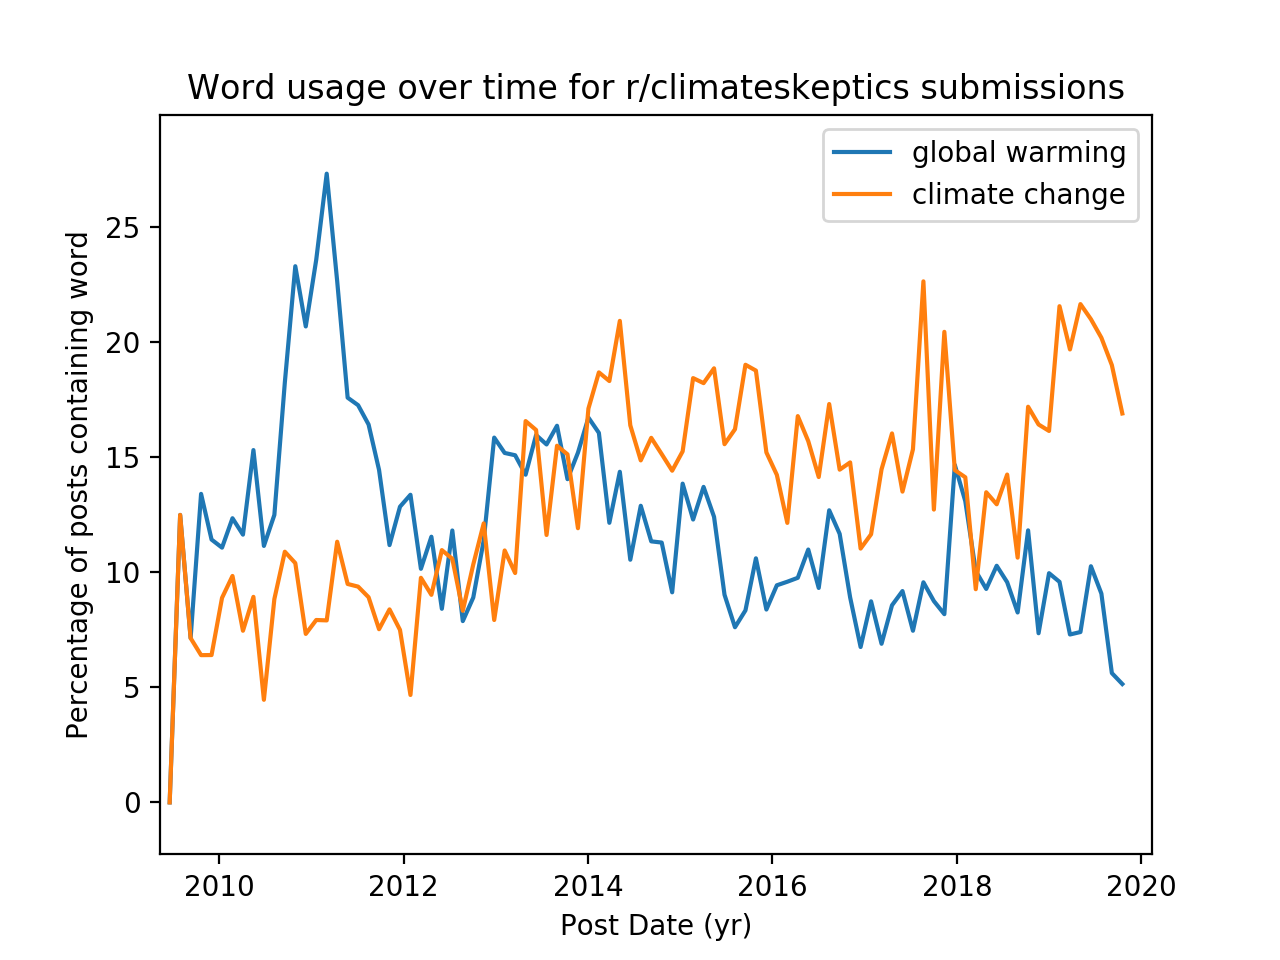
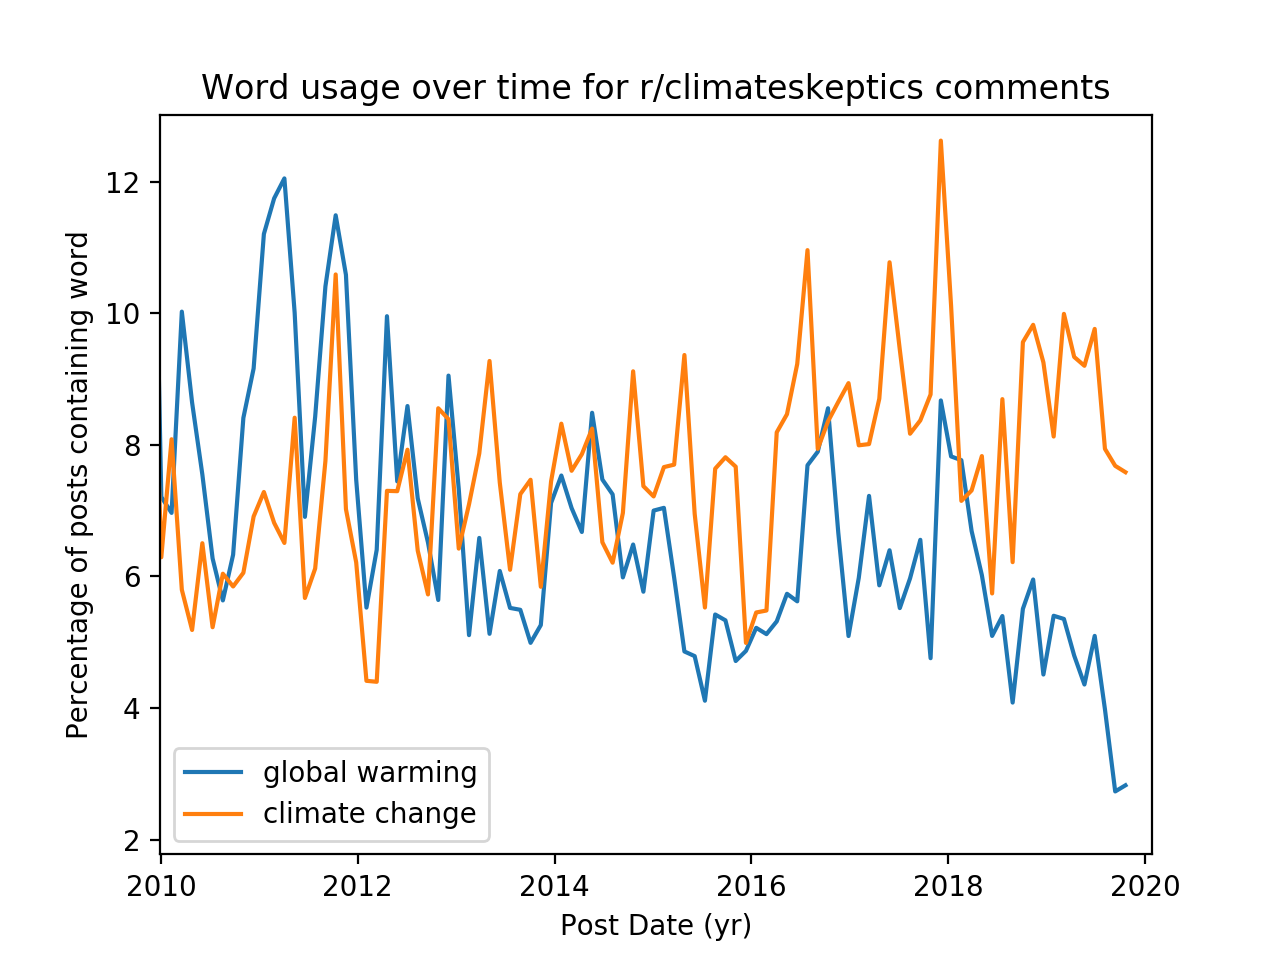
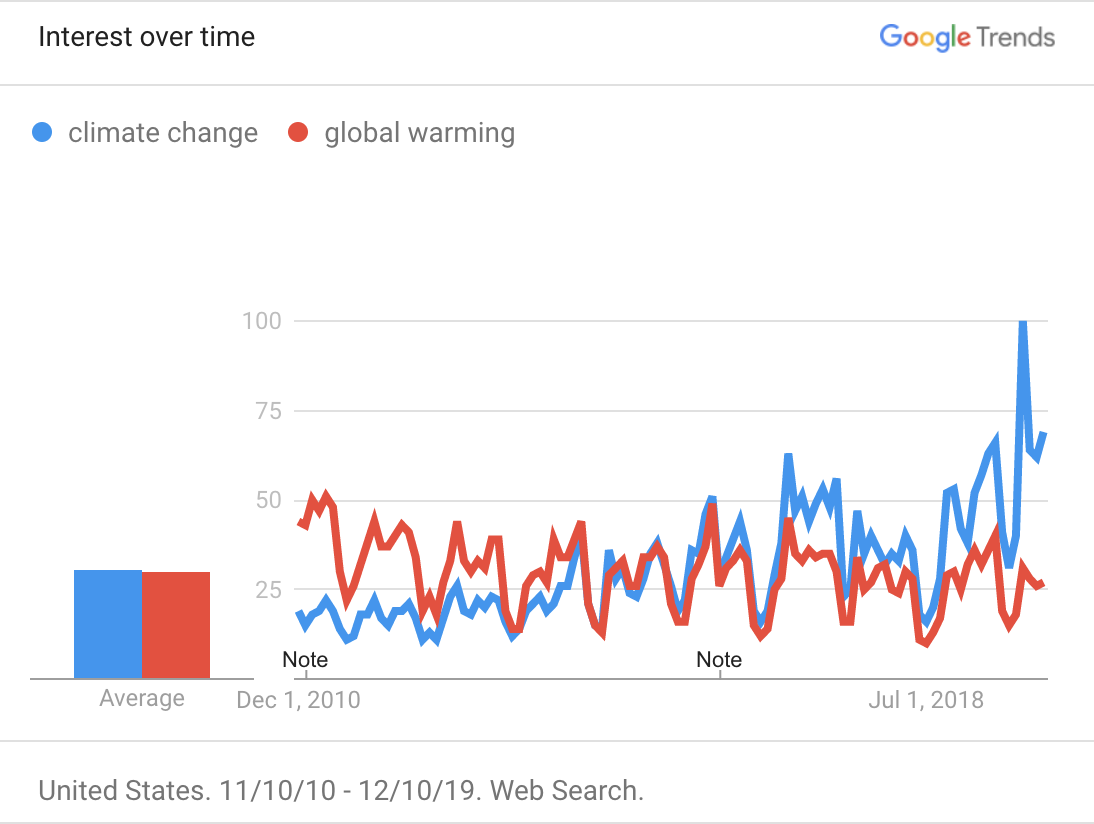
We notice that accross endpoints, the trendlines look fairly similar, but across subreddits there is a noticeable difference. In r/environmental_science, the prevalence of “climate change” in posts has always dominated “global warming”. But in r/climateskeptics, “global warming” used to be a more common term, and over time was superceded by “climate change.” In google search trends, we observe a similar inversion
The terms “global warming” and “climate change” are often used interchangeably in the public lexicon, but in a scientific context they refer to two distint things. Perhaps that the discussion in r/enviromental_science shakes the trend is indicative that the discussion in that subreddit is more scientific in nature.
Linking
What websites are commonly linked to in r/climateskeptics? How does this compare with r/sustainability? Which news sources are popular amongst r/climateskeptics submitters? In this section, we’ll uncover the data and try to answer these questions!
One particularly common type of reddit submission is one that is made up of a title and a link. Here’s an example of a r/climateskeptics submission that links to a Breitbart article:
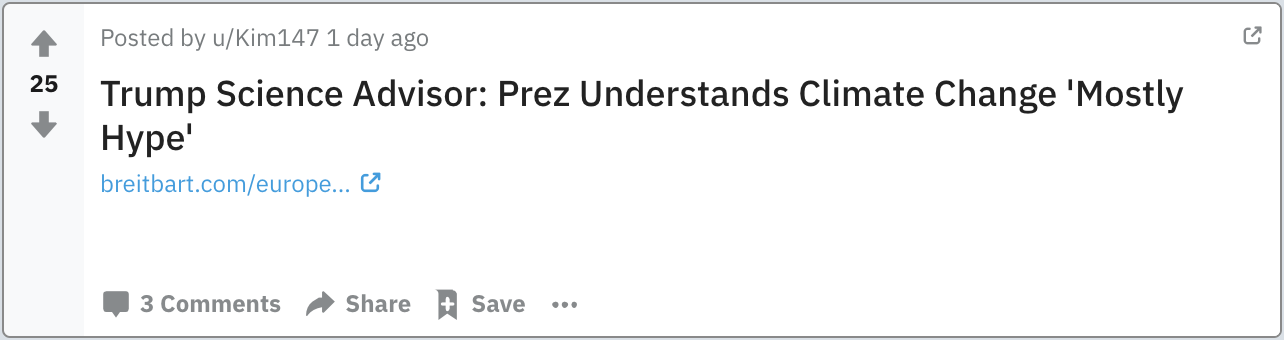
Programmatically, once we have a submission returned by a query to the pushshift API, we can access the full url by using the "url" field:
"https://www.breitbart.com/europe/2019/12/08/happer-trump-understands-climate-change-is-mostly-hype/"
However, for our purposes, we only want the domain name. This is because using the domain name will allow us to count the number of times different domains are linked to in different subreddits. To get the domain name, we can use the value in the "domain" field. For the example submission above, this would be "breitbart.com".
Popular Websites by Subreddit
Here are the top 7 domains linked to from r/climateskeptics:
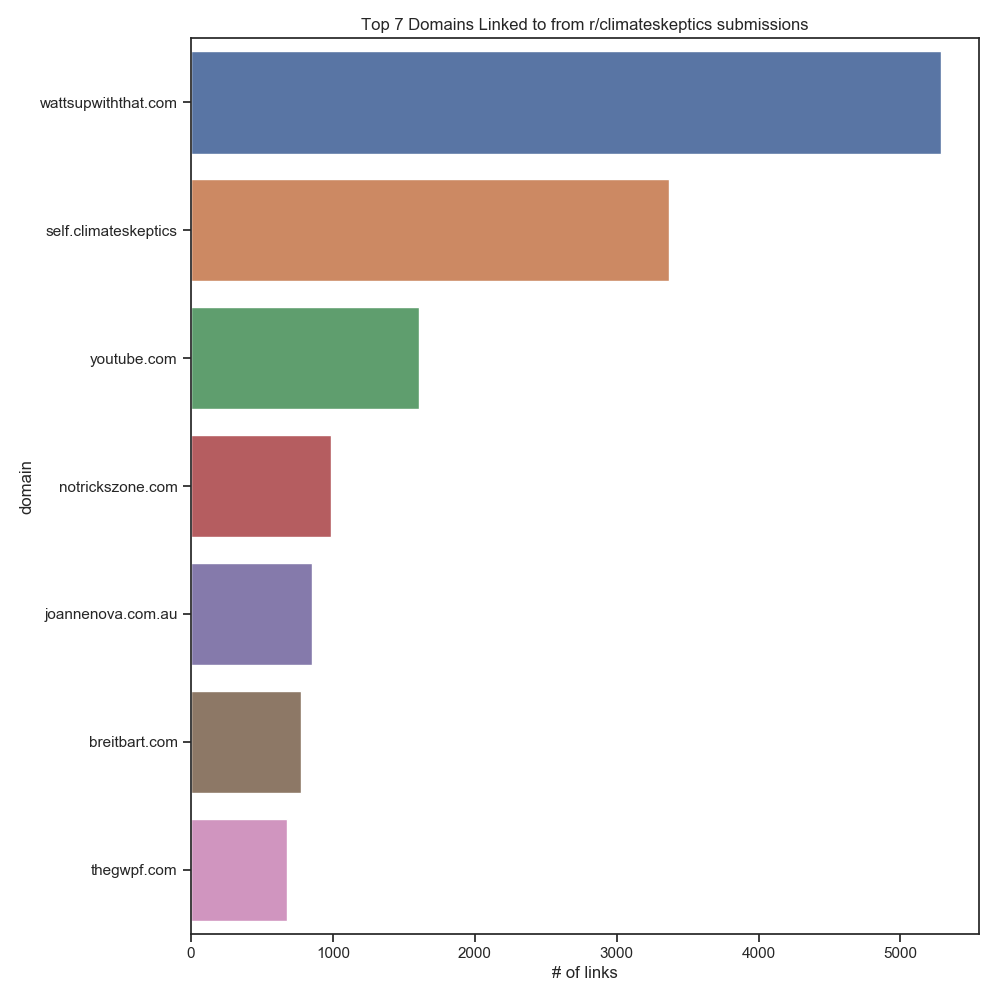
If you’re feeling adventurous, try going to some of those websites and delving into the world of climate skepticism (maybe not for too long).
News
The Pew Research Center conducted a study in which they rated the political stances of news outlets on the left-right political spectrum. Here’s their diagram illustrating their findings:
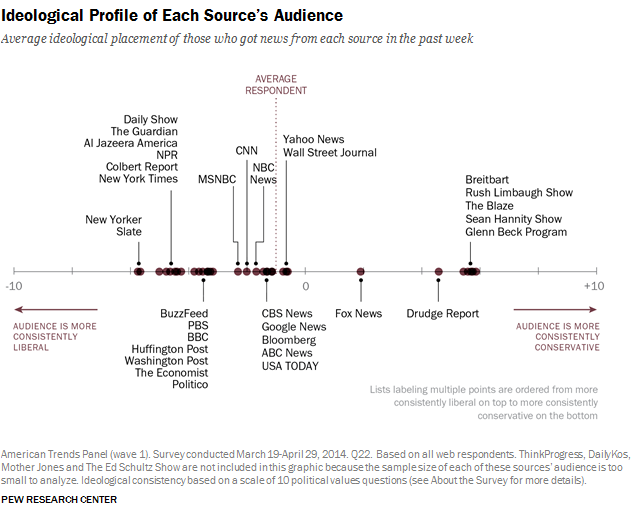
Let’s use this as a starting point, by defining a list with some of the more popular of these news domains from left to right:
WORLD_DOMAINS_LEFT_TO_RIGHT = ["nytimes.com", # the most left wing news outlet
                               "bbc.com", "huffingtonpost.com", "washingtonpost.com",
                               "cnn.com",
                               "nbcnews",
                               "news.google.com", "abcnews.go.com",
                               "wsj.com", # a centrist news outlet
                               "foxnews.com",
                               "breitbart.com" # the most right wing news outlet
                               ]
We’ll also want to choose a list of subreddits to investigate. Let’s use a bunch of climate and environment related subreddits:
CLIMATE_SUBREDDITS = ["globalwarming",
						  "globalclimatechange",
						  "environment",
						  "renewableenergy",
						  "climateskeptics",
						  "climatenews",
						  "climatechange",
						  "climateactionplan"
						  ]
Great, now let’s write some code, starting with some imports:
from reddit import query_n
from seaborn import sns
from collections import Counter

import matplotlib.pyplot as plt
Now, let’s write code to count the number of submissions that link to each news outlet, by subreddit.
def news_domains_by_subreddit(category, subreddits, domains):
    params = {"subreddit": ",".join(subreddits), "domain": ",".join(domains) }
    results = query_n(category, params, n=10000)
    subreddit_counter = Counter([ r["subreddit"] for r in results])

    news_subreddits = [subreddit for subreddit,_ in subreddit_counter.most_common(10)]
    params = {"subreddit": ",".join(news_subreddits), "domain": ",".join(domains) }
    results = query_n(category, params, n=20000)
    subreddit_counter = Counter([ r["subreddit"] for r in results])
    counter = Counter([(r["domain"], r["subreddit"]) for r in results])

    for r in results:
        domain_count = counter[(r["domain"], r["subreddit"])]
        subreddit_total = subreddit_counter[r["subreddit"]]
        r["proportion"] = domain_count/subreddit_total

    return pd.DataFrame.from_records(results)[["subreddit", "domain", "count"]]
def plot_news_domains_by_subreddit(subreddit_domains_df):
    color_palette = sns.color_palette("coolwarm", len(domains))
    plt.subplots(1,1, figsize=(15,10))
    ax = sns.barplot(y = "proportion",
                     x = "subreddit",
                     orient = "v",
                     hue = "domain",
                     hue_order = domains,
                     data = subreddit_domains_df,
                     palette = color_palette)

    ax.set_ylabel(f"# of news links")
    ax.set_xlabel(f"subreddit")
    plt.legend(frameon = False, loc='upper right')
    plt.tight_layout()
    ax.get_figure().savefig("subreddit_news_horizontal.png")
Finally, let’s run our code and plot the results:
df = news_domains_by_subreddit("submission", CLIMATE_SUBREDDITS, LEFT_TO_RIGHT)
plot_news_domains_by_subreddit(df)
Here is the output plot. The news outlets colors range from dark blue to dark red where dark blue represents left wing politics and dark red represents right wing politics.
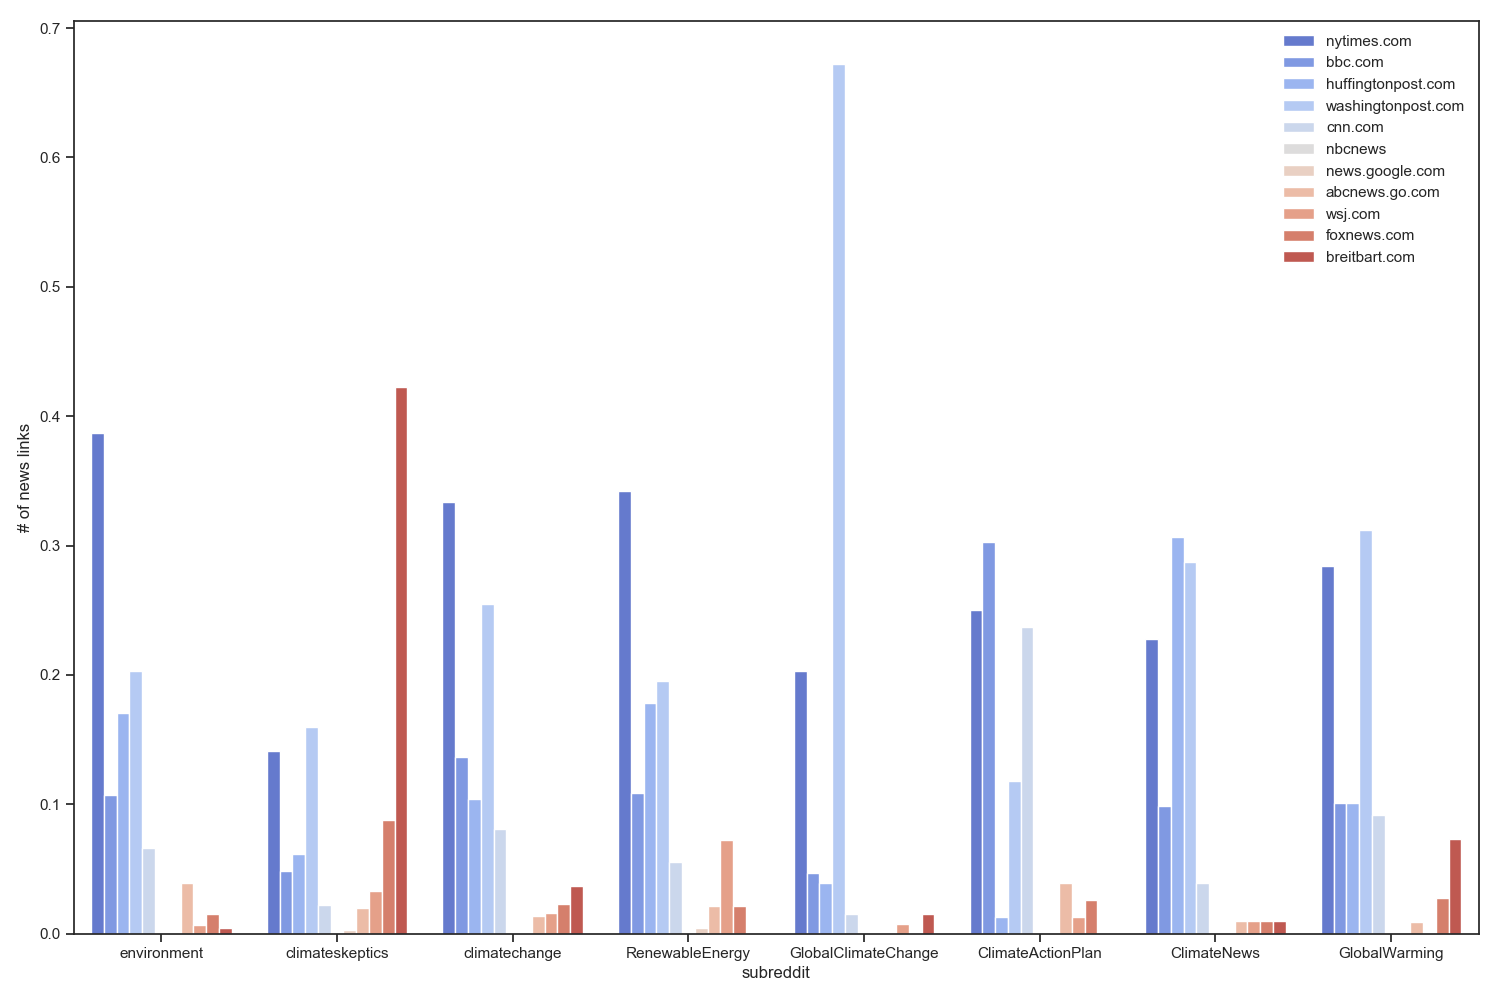
We can immediately see that r/climateskeptics submissions have a lot more right wing news outlet links. The tallest red bar represents breitbart.com, which is makes up over 40% of news links among the outlets we are considering.
Another interesting find is that while most other subreddits have good representation for a lot of different news outlets, r/GlobalClimateChange seems to have disproportionately many
Sentiment Analysis
Sentiment analysis is a technique that allows us to quantify the sentiment of different sentences. For example, we can use sentiment analysis to analyze how much positivity, negativity and neutrality a sentence has. Sentiment analysis models are usually supervised, meaning that they are learned or “trained” from labeled data. For example, we could train a sentiment analysis on the following labeled data:
| Sentence | negativity | neutrality | positivity |
|---|---|---|---|
| We cleaned 40 pounds of trash from our beach ! (link) | 0.0 | 1.0 | 0.0 |
| Getting reaaally tired of these alarmist headlines all over the media in my country. (link) | 0.182 | 0.818 | 0.0 |
In practice, we would need a lot more labeled examples like these in order to train a performant sentiment analyzer. Unfortuntatly, we don’t have any such labeled examples (we don’t have any positivity/negativity/neutrality scores)!
Luckily, others have compiled large datasets of sentences and manually labeled them with sentiment scores. They then trained the sentiment analysis model on that data and made the trained model available to the public (that’s us)!
The specific model we’re going to use is called VADER, and is part of python’s Natural Language Toolkit (nltk).
Let’s start by importing the the sentiment analyzer and a few other libraries. In particular we’ll also want to import nltk’s sentence tokenizer, which splits text into sentences and splits each sentence into a list of tokens, which can be words or punctuation.
from reddit import query_n, BIG_LIST

import matplotlib.pyplot as plt
import seaborn as sns

from nltk.sentiment.vader import SentimentIntensityAnalyzer
from nltk.tokenize import sent_tokenize
import pandas as pd
Next, let’s define a function that queries submissions and comments, performs sentiment analysis, and then computes the averages positivity/negativity/neutrality scores accross all of the sentences of each subreddit:
def sentiment_analysis(category, subreddit, n = float("inf")):
    all_sentences = []
    results = query_n(category, {"subreddit": subreddit}, n=n)
    for result in results:
        text_fields = ["title", "selftext", "body"]
        submissions = [result[field] for field in text_fields if field in result]
        submission_text = "\n".join()
        sentences = sent_tokenize(submission_text)
        all_sentences.extend(sentences)

    sentiment_analyzer = SentimentIntensityAnalyzer()
    score_sums = {"pos": 0, "neu": 0, "neg": 0, "compound": 0}

    if not all_sentences:
        print(f"Skipping {subreddit} (no submissions)")
        return score_sums

    for sentence in all_sentences:
        polarity = sentiment_analyzer.polarity_scores(sentence)
        for score_category in polarity:
            score_sums[score_category] += polarity[score_category]
    print("Subreddit:", subreddit)
    score_avgs = {k:round(v/len(all_sentences), 3) for k,v in score_sums.items()}
    print(f"Num sentences: {len(all_sentences)}")
    return score_avgs
Now, let’s call our sentiment_analysis function on each of the climate related subreddits from our curated list:
def exec_sentiment_analysis(n = float("inf")):
    records = []
    for i, subreddit in enumerate(BIG_LIST):
        score_avgs = sentiment_analysis("comment", subreddit, n = n)
        for score_type in ["compound", "neu", "pos", "neg"]:
            score = score_avgs[score_type]
            record = {"subreddit": subreddit, "score_type": score_type, "score": score}
            records.append(record)

    sentiment_df = pd.DataFrame.from_records(records)
    sentiment_df.to_pickle("sentiment_df.pickle")

    return sentiment_df
Finally, let’s write some code to plot the subreddits in order of their sentiment scores (e.g. most negative subreddits, most positive subreddits):
def plot_sentiment_analysis(sentiment_df = None, sort_score_type = "pos"):
    sentiment_df = sentiment_df or pd.read_pickle("sentiment_df.pickle")

    plt.clf()
    f, axs = plt.subplots(
    		15,
    		15,
    		figsize=(60, 60),
    		sharex = True,
    		sharey = True,
    		squeeze = True)

    ax_array = axs.flatten()
    def sorter(subreddit):
    	df = sentiment_df
    	select_subreddit = df["subreddit"] == subreddit
    	select_score_type = df["score_type"] == sort_score_type
    	return df[select_subreddit & select_score_type].iloc[0]["score"]

    sorted_subreddits = sorted(BIG_LIST, reverse = True, key = sorter)

    for i,subreddit in enumerate(sorted_subreddits):
        sns.barplot(
        	x="subreddit",
        	y="score",
        	hue="score_type",
        	hue_order=["neg", "neu", "pos"],
        	data=sentiment_df[sentiment_df["subreddit"] == subreddit],
        	ax = ax_array[i])
        ax.set(xlabel=subreddit)

    f.savefig(f"sentiment_plot_{sort_key}.png")
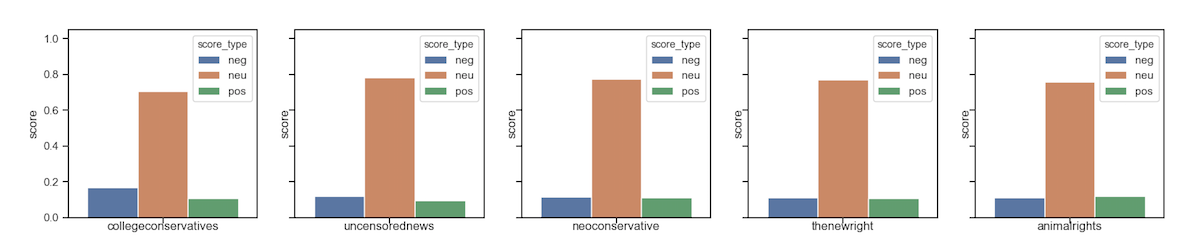
The Top 5 Most POSITIVE Subreddits:
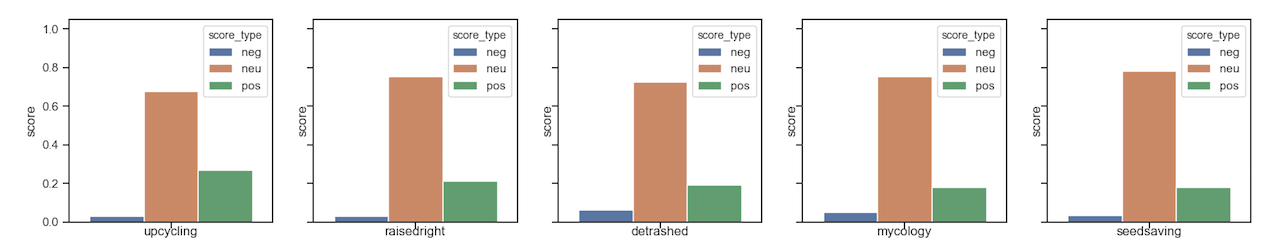
The Top 5 Most NEGATIVE Subreddits:
Related Work
Before settling on Reddit, we considered a number of other social media platforms and sources of data. We decided to pursue Reddit, because we found that a number of studies have already attempted to characterize climate skepticism on those platforms. We’ll mention a number of those papers and articles here, as they informed our experiments and provide interesting perspectives
- S. Stepchenkova et al. analyze the quality of crowdsourced data vs data collected by paid workers about climate change discourse on Twitter.
- John Swain’s Medium Article provides some beautiful visualizations and an in depth discussion of the flow of climate conversation through the Twitter graph
- This UN Global Pulse study found that the Global Climate March and Global Climate Summit in 2014 significantly increased the amount of conversation about climate change on twitter
- E. Bloomfield et al. studies climate skeptic communities on Facebook. They find that posters provide links to give the appearance of credibility
- Dawn Stover’s article explains how Facebook and Twitter facilitate the spread of climate missinformation
- This Environmental Data & Governance Initiative report reveals that the term “climate change” has been dissapearing from government websites under the Trump Administration